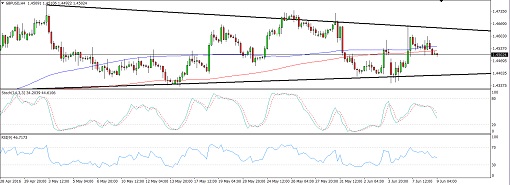
GBPUSD Triangle Pattern (June 09, 2016)
GBPUSD has formed higher lows and lower highs, creating a symmetrical triangle pattern on its 4-hour time frame.
Price has just bounced off the top of the triangle and might be ready for a test of support.
Stochastic is on the move down so price might follow suit, taking it down to support at the 1.4400 major psychological level. RSI is also heading south, indicating that pound bears are in control of price action. Once these oscillators reach the oversold levels, buyers could push the pair back up again.
The 100 SMA is still above the 200 SMA so the path of least resistance is to the upside for now. However, a downward crossover could bring more sellers back in the game, triggering a downside breakout for the pair. If so, GBPUSD could be in for a 350-pip drop, which is roughly the same height as the chart formation.
Data from the UK came in stronger than expected yesterday, with manufacturing production up by 2.3% versus the projected flat reading. However, the pound seemed to shrug off this report as it focused mostly on Brexit updates.
So far, polls are showing mixed outcomes in terms of the lead swinging in favor of the "leave" or "stay" camps. These updates could continue to affect GBPUSD in the days leading up to the referendum, although a stronger lead in favor of either camp could lead to a breakout.
As for the dollar, the downbeat NFP report and words of caution from Fed head Yellen are keeping a lid on its gains. Traders are no longer expecting a Fed rate hike in this month's meeting and are pricing in weaker odds of tightening for next month.
By Kate Curtis from Trader's Way
